Moneyway is one of the services that can prove most useful for a professional tipster.
It is the perfect tool to understand how the market, and bettors and traders around the world, are taking a stand on individual matches. It is possible to understand where important game volumes are positioned, both on the 1X2 market and on the Under / Over market.
Our representation is based on the total bet on the Betfair.com betting platform, almost in real time.
Our strength is that this indicator, combined with many others that we provide on the site, allows you to have sufficient information to allow us to choose a strategy on the match.
You can discover anomalous volumes on unknown leagues, or have confirmation that the game you have chosen is doing just the right thing!
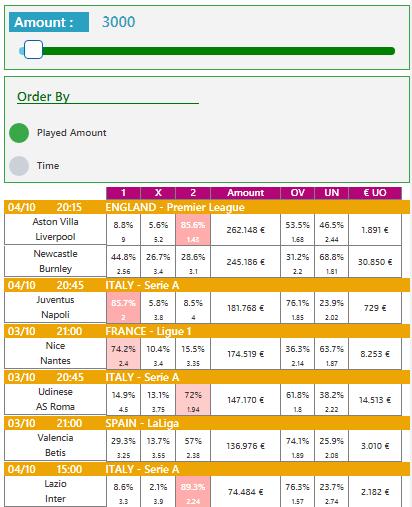
The free version that you find on our site, in the “Services” section, gives you the snapshot at the moment of the volume played and the percentage on the single sign.
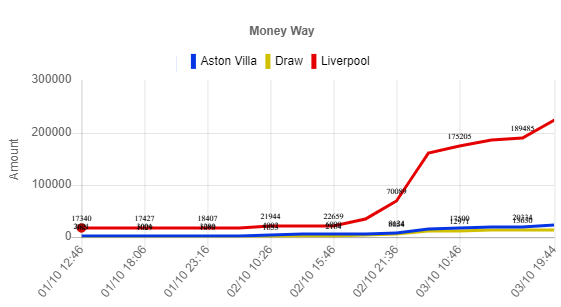
In the PRO version, among the many features offered, you have the ability to view the graph of the trend of volumes over time.