Betting Experience, in addition to providing a probability of exit for the single outcome, provides advanced information to allow you to study the single game in all the smallest details.
The program collects an incredible amount of information, including:
- Statistics of the teams and the competition
- Share movements on Asian markets
- Share movements on European markets
- Game volumes
- Info on the rankings, on the last games played, on the state of form of the 2 teams
All this information translates into numbers, which can often be difficult to understand. But, once made ours, they can provide considerable help for our bets.
Expert mode can be accessed in two ways:
To see all the games in this mode, it is possible to select the “Expert Mode”

To see the single game in this mode, press the “+” button to the right of the game.
Expert mode: let’s learn how to read numbers
By opening the screen using the expert mode tick, all the games will be represented as shown in the figure below.
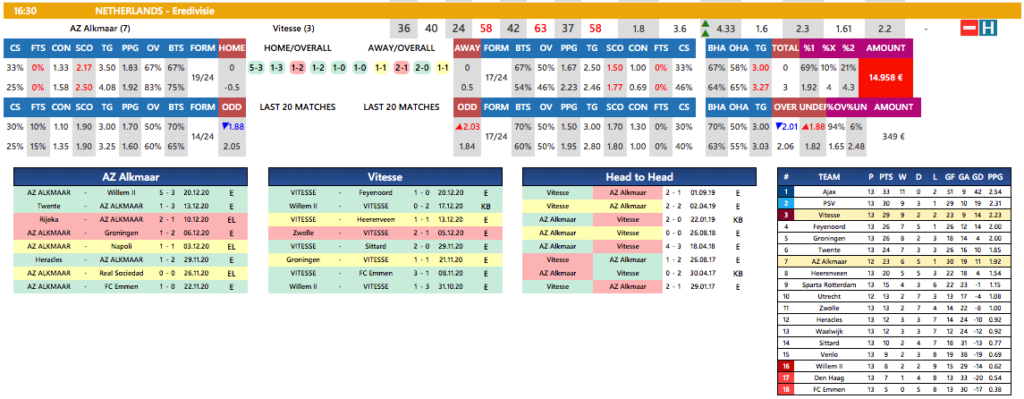
The data contained is divided into 3 categories:
Statistical Data: with BLUE header
Odds movements: with RED header
Game volume data: with PURPLE header
Prediction (PRED): with PURPLE header
The prediction shows the results with the highest probability that the Betting Experience algorithm has evaluated for the match.
Expert mode: reading statistical data
You will find all the data relating to the statistics of the teams in BLUE.
The meaning of the lines
Before analyzing in detail the meaning of the individual values, it is good to understand what the single row of values refers to.
There are 4 rows for the statistics:
- The first two rows are related to the team data for the competition being played
- The second two rows refer to the last 20 games played by the team in all competitions (friendlies excluded)
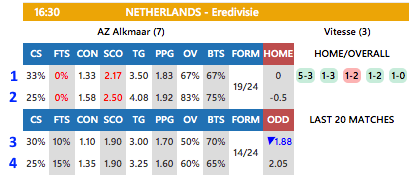
In the example below, row 1 and row 2 refer to the games played by the “AZ Alkmaar” team in the Dutch Eredivisie. Row 3 and row 4 refer, instead, to the last 20 games played by AZ Alkmaar in all the competitions it has faced.
Moreover:
- Row 1 and row 3, for the home team, refer exclusively to home games. Similarly, for the away team, row 1 and row 3 refer exclusively to the games played away by the team.
In summary, then:
- ROW 1: games played at home by the home team, away from the away team, for the competition related to the match
- ROW 2: games played both at home and away for both teams, for the competition related to the match
- ROW 3: games played at home by the home team, away from the away team, relating to the last 20 games played by the team
- ROW 4: games played both at home and away for both teams, relating to the last 20 games played by the team
The meaning of the columns
Let’s move on to the meaning of the individual values relating to the statistics:
- Clean Sheet (CS): percentage of matches in which the team has not conceded goals, ending the match with a clean sheet.
- Failed to Score (FTS): percentage of matches in which the team failed to score any goals.
- Conceded (CON): Average number of goals conceded by the team.
- Scored (SCO): Average number of goals scored by the team.
- Points-per-Game (PPG): Average number of points scored by the team (V = 3 points, N = 1 points, P = 0 points). In case of head to head competition, all the matches played by the team in the competition are taken into account, as if it were a group tournament.
- Over (OV): percentage of team matches in which the Over 2.5 sign has occurred.
- Both-Teams-to-Score (BTS): Percentage of team games in which both teams have scored.
- Form (FORM): Sum of points of the last 8 games played by the team (less, if less than 8 have been played). In the example, 15/24 means that the home team in the last 8 games has scored 15 points out of 24 available.
Combined statistics
The latest stats values, found on the right in the desktop version and bottom left in the mobile version, refer to the combined average values between the home team and the away team.
They are useful values for studying the statistical link between the two teams. We find them in the figure below.
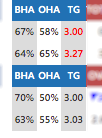
For the first row the values are:
- BTS Home / Away (BHA): Arithmetic average between the percentage of games in which the home team has GG at home and the percentage of games in which the away team has done GG away.
- Over Home/Away (OHA): Media aritmetica tra la percentuale delle partite in cui la squadra di casa ha fatto Over in casa e la percentuale delle partite in cui la squadra in trasferta ha fatto Over in trasferta.
- Total Goals (TG): Media tra il numero medio di gol nelle partite in casa della squadra di casa e il numero medio di gol nelle partite in trasferta della squadra in trasferta.
For the other rows, the combinations discussed above are valid, where for row 2 both home and away matches of both are considered, and for rows 3 and 4 the last 20 games played by the teams in all competitions are taken into account.
The values of the Asian market
The Asian market is the market that first senses changes in odds based on bettors’ bets. Keeping an eye on this market allows you to understand how bettors around the world are behaving on the game. Some books quote these types of bets. However, having indications from these values is an excellent basis for deciding how to bet on a single game.
A little familiarity with asian parameters is needed. At the moment it is enough to think that the team favored by the books has the sign “-“, that the higher the negative value, the higher (according to the books) that the team wins, and that any changes in values may indicate an imbalance odds in favor of one or the other team.
An article on our blog (in Italian language that you can automatically translate) explains 2 things in depth:
- Why it is important to consider the Asian handicap
- How is it possible to interpret it
You can find the article here, and I recommend that you make it yours: Asian Handicaps.
Let’s take 2 different Asian configurations as an example to explain the values, as in the figure.
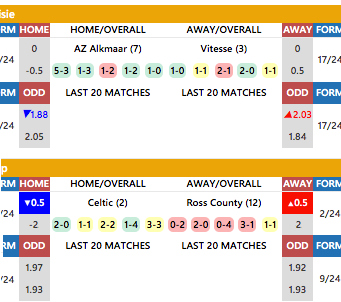
Home / Away (Odd): The values are divided into 4 lines:
- ROW 1: odds movement in favor or against the team of the current odd with respect to the opening odd. In the first case, there was no movement in the Asian odd, in the second case the Asian handicap moved by -0.5 in favor of the home team, significantly lowering the share.
- ROW 2: the current Asian handicap. In the first case the handicap remained the same, in the second case it started from 1.5 and increased by 0.5. The Asian handicap, at the moment, for the second game is -2 for the home team.
- ROW 3/4: Indicates the variation between the current value of the odds (row 3) and the opening value (row 4) for the Asian handicap. In the first case the share of the home team is slightly decreasing and the market is betting more on it. Also in the second case there is an increase for the away team, however not relevant as the handicap has been moved by -0.5 in favor of the home team.
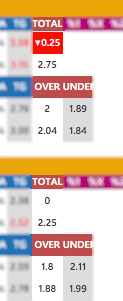
Total Line (Total): The Total Line indicates the total value of goals expected in the match, based on the Asian market. The top value indicates a greater (if positive) or less (if negative) variation in expected goals in the match. As in the previous example, in the first row we have a possible increase or a possible decrease in the number of goals expected in the match (in the first case it is decreasing, in the second case stable. The second line indicates the number of goals expected at the start. The third and the fourth line indicate the bookmaker’s final and initial odds.
The volume of bets
The Betfair bookmaker is one of the few that allows, for some games, to view the exact amount that is being played on a single game. This information is very helpful in opening the market how it moves on the single game. A high percentage of play on a single sign makes us ring a bell as to who might be the favorite.
This info is often referred to as “Moneyway“.
For the games for which Betfair provides us the values, Betting Experience displays the info in the figure.
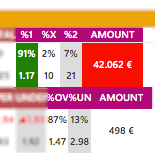
- 1 X 2: percentage of amounts played on the match for the final outcome 1X2 on the Betfair bookmaker compared to the total volumes of play.
- Amount: Total amount wagered on the Betfair bookmaker on the match.
- Over / Under: percentage of amounts played on the match for the number of goals (Over / Under 2.5) on the bookmaker Betfair compared to the total volumes of play.
In this case, albeit with a low odds, the home team is very much played by Betfair users. The same goes for the Over sign.